Latency and packet
loss monitoring
Improve your network diagnostic and reduce the number of downtimes
Specialized tool purposefully designed to simplify network monitoring.
CocoPacket keeps track of latency, packet loss, and traceroute.
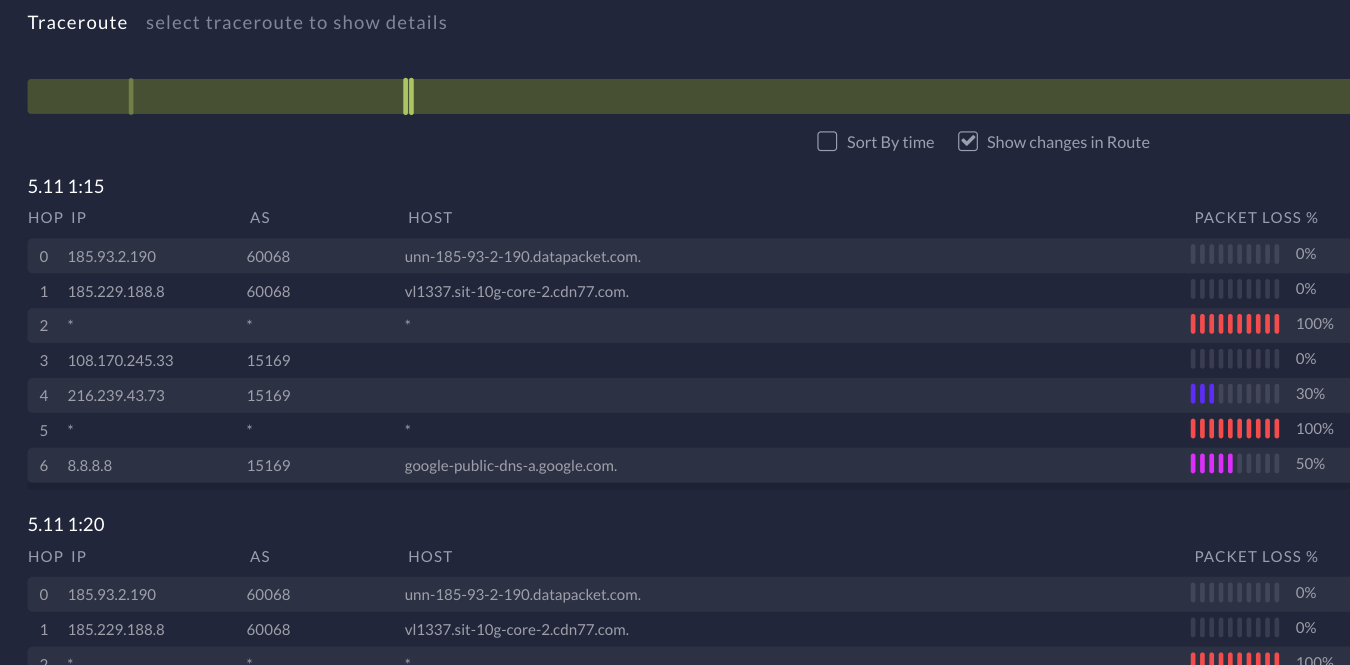
Traceroute
Traceroute is an essential tool for any network diagnostics.
It helps with visualization of individual network routes
by exposing all the routers that every packet has to visit to reach its final destination.
We simply bring it to the next level with traceroute history.
CocoPacket's traceroute log collects traceroutes for every connection with an interval of your choosing.
The algorithm is also capable of modifying the interval when anomalies in the network are detected
so that you can access all the relevant information you need at any time.
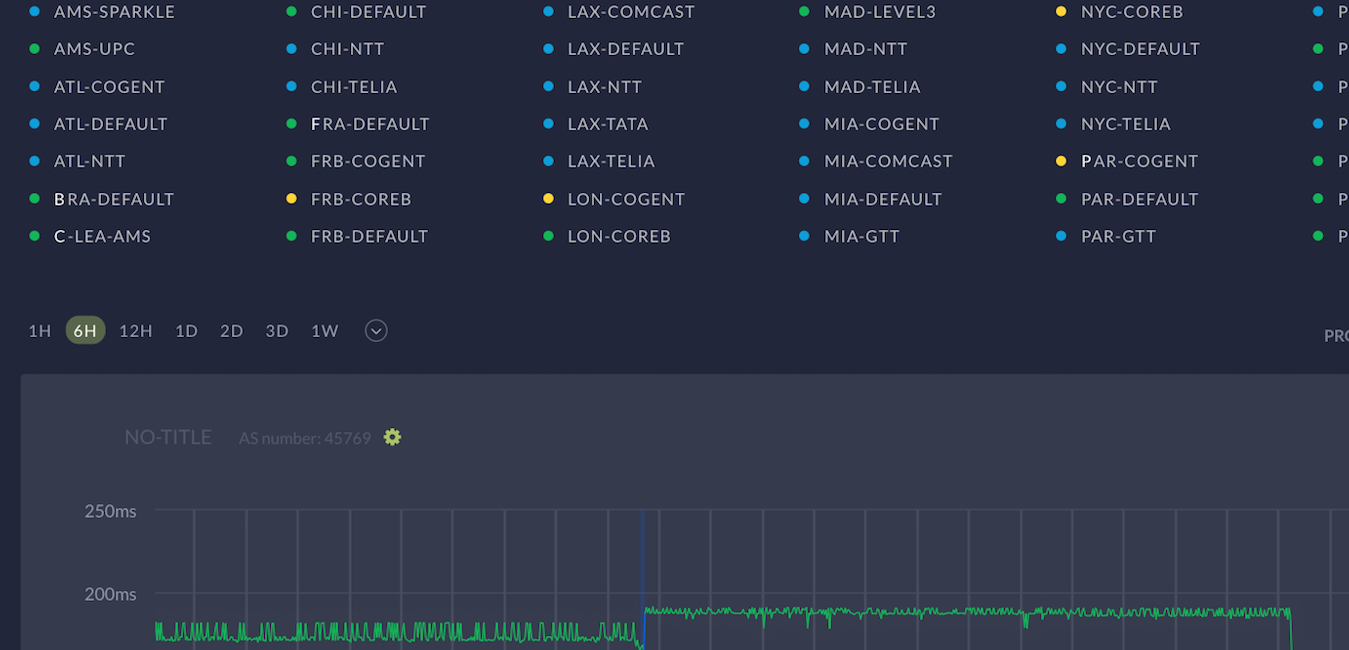
Multiple test locations
Multiple monitoring locations allow users to collect network data from places around the world.
Data from multiple locations result in faster diagnostics, easier routing, and better overall decision making.
Unique cases may highly benefit from private monitoring locations. (e.g., private networks).
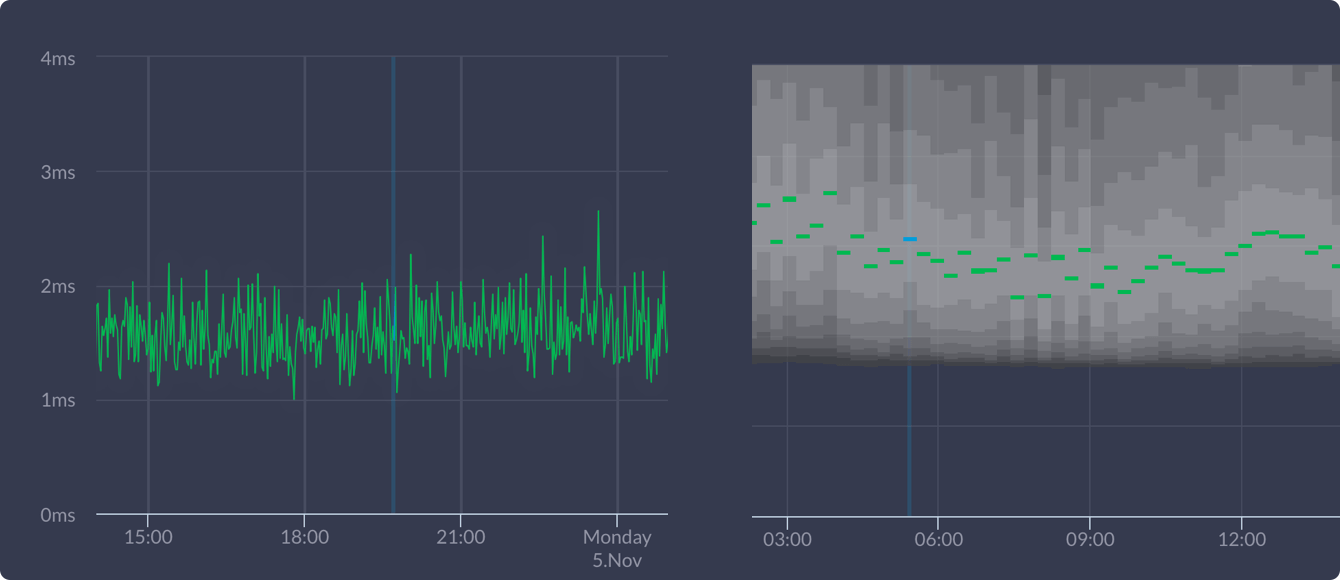
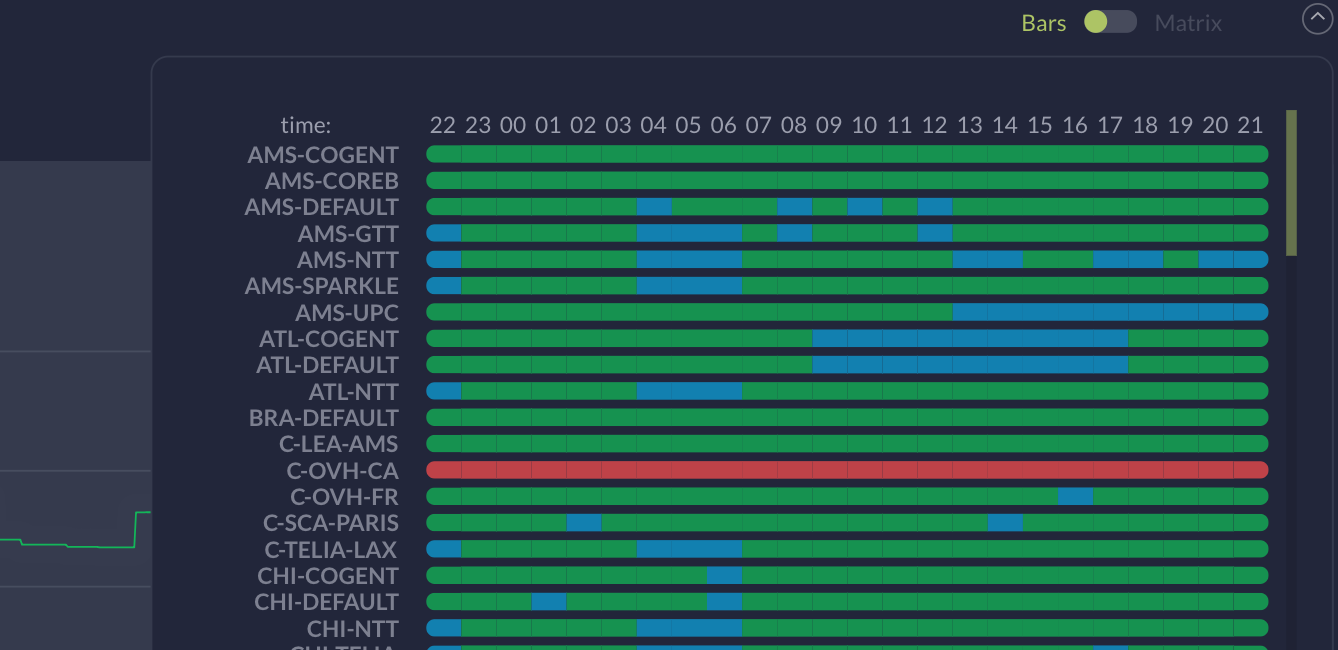
Data representation The amount of data collected by network monitoring is substantial and without a correct representation could be overwhelming. We are always searching for ways to improve, innovate and simplify the data representation. Have a look at CocoPacket's two different graph representations - basic and advanced (smoke).
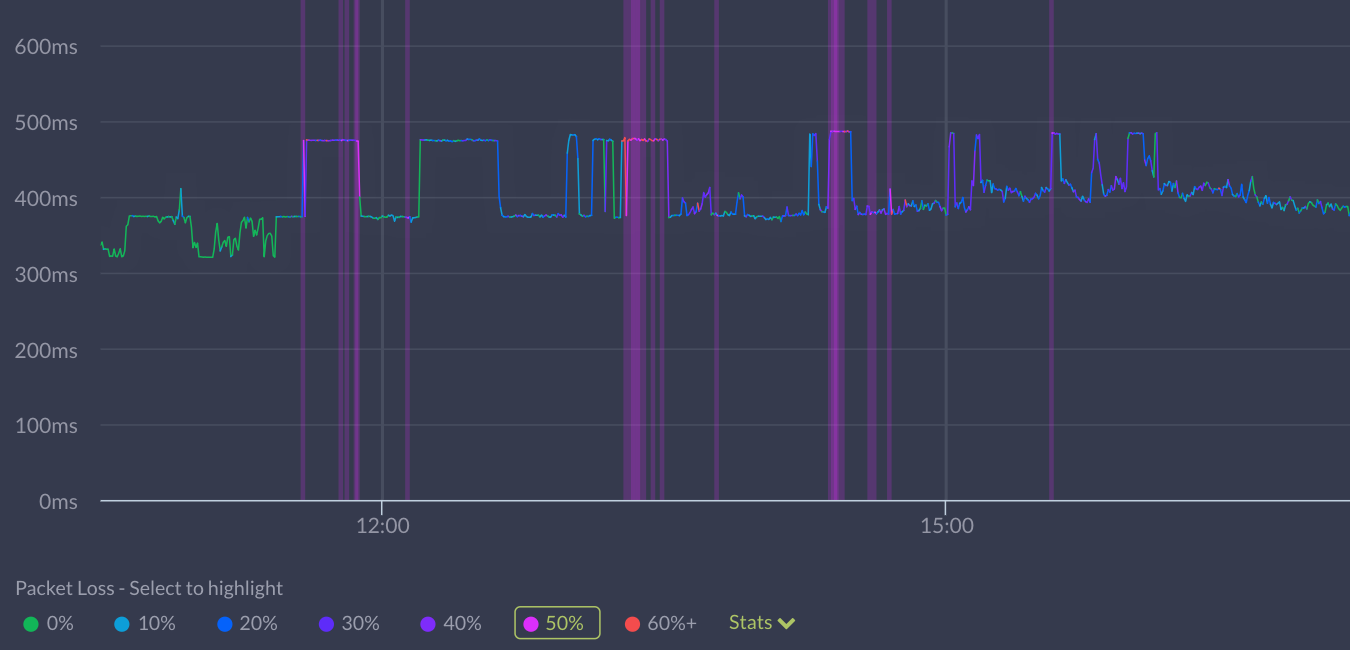
Highlighting problematic sections Spot an issue at first glance. Highlight individual packet loss groups in any graph with a single click.
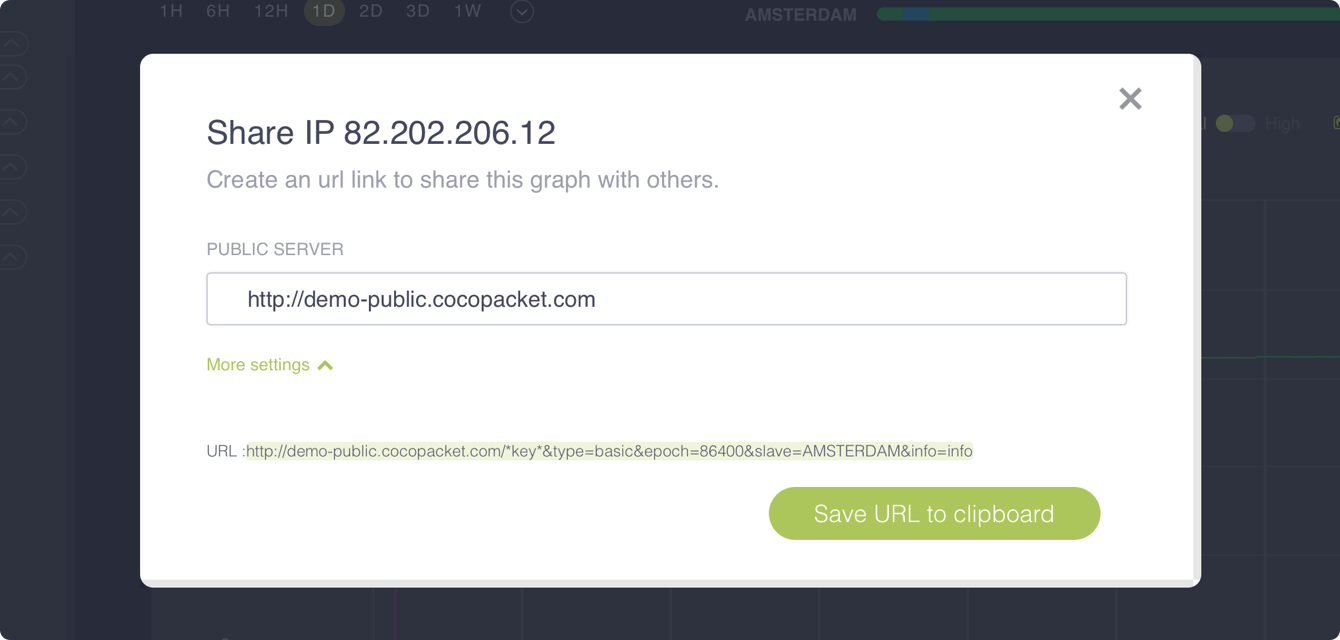
Graph sharing Share graphs with anyone. CocoPacket provides a simple way to let others access your monitoring data, which may significantly improve the debugging process. Graph sharing can also be quite beneficial for proving the status of your network.
Datacenter probe Take advantage of setting up probes in our datacenters located all over the world. Multiple test locations can significantly improve your network monitoring.
Basic The Basic graph is a data representation that focuses on delivering: high informativeness, high loading speed, and low complexity. It is designed to be a precise tool for a quick data analysis.
Private probe CocoPacket offers an option for connecting private probes. Contact our support team for more details about probe installation.
Advanced (smoke) The advanced graph is inspired by the SmokePing, invented by Tobias Oetiker. It builds on the core principles of its graph construction.
Troubleshoot your network faster than ever before
CocoPacket is designed to help everyone who is concerned about their network stability.